1 Introduction
In this Tutorial we will use Raspberry Pi Pico. We will log data from a Temperature Sensor using MicroPython. We will use a basic TMP36 Temperature Sensor. We will Log Temperature Data on a File on the Raspberry Pi Pico Device. Then we will copy the File to our PC and are then ready to do some Data Analysis. We will create a simple Python Script that opens the File and Plot the Data. Here we will use ordinary Python and the matplotlib. The tutorial will use the TMP36 as an example, but you can of course use any kind of sensor(s).
Raspberry Pi Pico and Logging Sensor Dato (YouTubes) + PowerPoint (PDF)
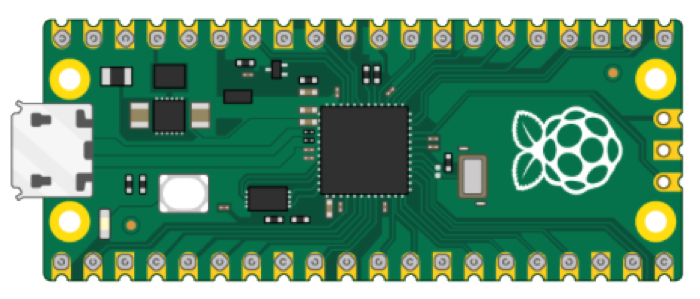
1.1 Raspberry Pi Pico
Raspberry Pi Pico is a “downscaled” version of the original Raspberry Pi and is more comparable with Arduino compared to the original Raspberry Pi. You also need to use a downscaled version of Python, called MicroPython.
Haven't used Raspberry Pi Pico before? Getting Started with Raspberry Pi Pico
1.2 Python
As mentioned, Raspberry Pi Pico uses a downscaled version of Python, called MicroPython, but most of the original Python will work.
You could say MicroPython is a downscaled version of Python for microcontrollers like Raspberry Pi Pico, Micro:bit, etc. Since microcontrollers have limited resources like memory, RAM, etc., a full version of Python is not possible.
Here you will find more Python Resources.
2 TMP36 Temperature Sensor
TMP36 provides a voltage output that is linearly proportional to the temperature in degrees Celsius. It has an accuracy of ±1°C at +25°C and ±2°C in the −40°C to +125°C temperature range. For more details, see the TMP36 Datasheet.
The TMP36 Temperature Sensor will be covered in more detail in the tutorial Raspberry Pi Pico and TMP36 Temperature Sensor.
Here you see a basic MicroPython code example that reads data from the TMP36 Temperature Sensor:
from machine import ADC
from time import sleep

adcpin = 26
tmp36 = ADC(adcpin)

def ReadTemperature():
    adc_value = tmp36.read_u16()
    volt = (3.3/65535)*adc_value
    degC = (100*volt)-50
    return degC

while True:
    degC = ReadTemperature()
    print(round(degC, 1))
    sleep(5)
3 File Handling in Python/MicroPython
Basic File Handling is part of Python/MicroPython without the need to include any libraries.
Here you see a basic example where we Open and Write Data to a File in Python:
filename = "data.txt"
file = open(filename, "w")

data = "Hello World"
file.write(data)

file.close()
We use file = open(filename, "w") to open/create a file, then we use file.write(data) to write data to the file. Finaly we use file.close() to close the file.
In the open() function "w" means write data. We can use "a" (append) if you don’t want to delete existing data in an existing file.
Here you see a basic example where we Open and Read Data from a File in Python:
filename = "data.txt"
file = open(filename, "r")

data = file.read()
print(data)

file.close()
In the open() function "r" means read data.
Typically, when logging data from one or more sensors to file you need to use a While loop:
from time import sleep

filename = "data.txt"
file = open(filename, "w")

while True:
    data = "Hello World\n"
    file.write(data)
    file.flush()
    sleep(5)

file.close()
Here, it is important that you use file.flush() inside the While loop in order to save ("flush") data to the file in each iteration. If not, the data may not be saved to the file if you suddenly unplug the power supply from the Raspberry Pi Pico, etc.
More information/resources regarding File Handling in Python:
File Handling in Python (YouTube) + PowerPoint (PDF)
4 Datalogging
In the Datalogging part we will read data from a Temperature Sensor using Raspberry Pi Pico and MicroPython. We will then Log Temperature Data on a File on the Raspberry Pi Pico Device.
Lets start with this example:
from machine import ADC
from time import sleep

adcpin = 26
tmp36 = ADC(adcpin)

def ReadTemperature():
    adc_value = tmp36.read_u16()
    volt = (3.3/65535)*adc_value
    temp = (100*volt)-50
    degC = round(temp, 1)
    print(degC)
    return degC

# Open File
file = open("tmp36data.txt", "w")

def writefiledata(t, x):
    time = str(t)
    value = str(round(x, 2))
    file.write(time + "\t" + value)
    file.write("\n")
    file.flush()

k = 0
Ts = 5
while True:
    degC = ReadTemperature()
       writefiledata(k*Ts, degC)
    k = k + 1
    sleep(Ts)
Here we have created seperate functions for reading the Temperature and writing the data to a File.
Then we get the following results:
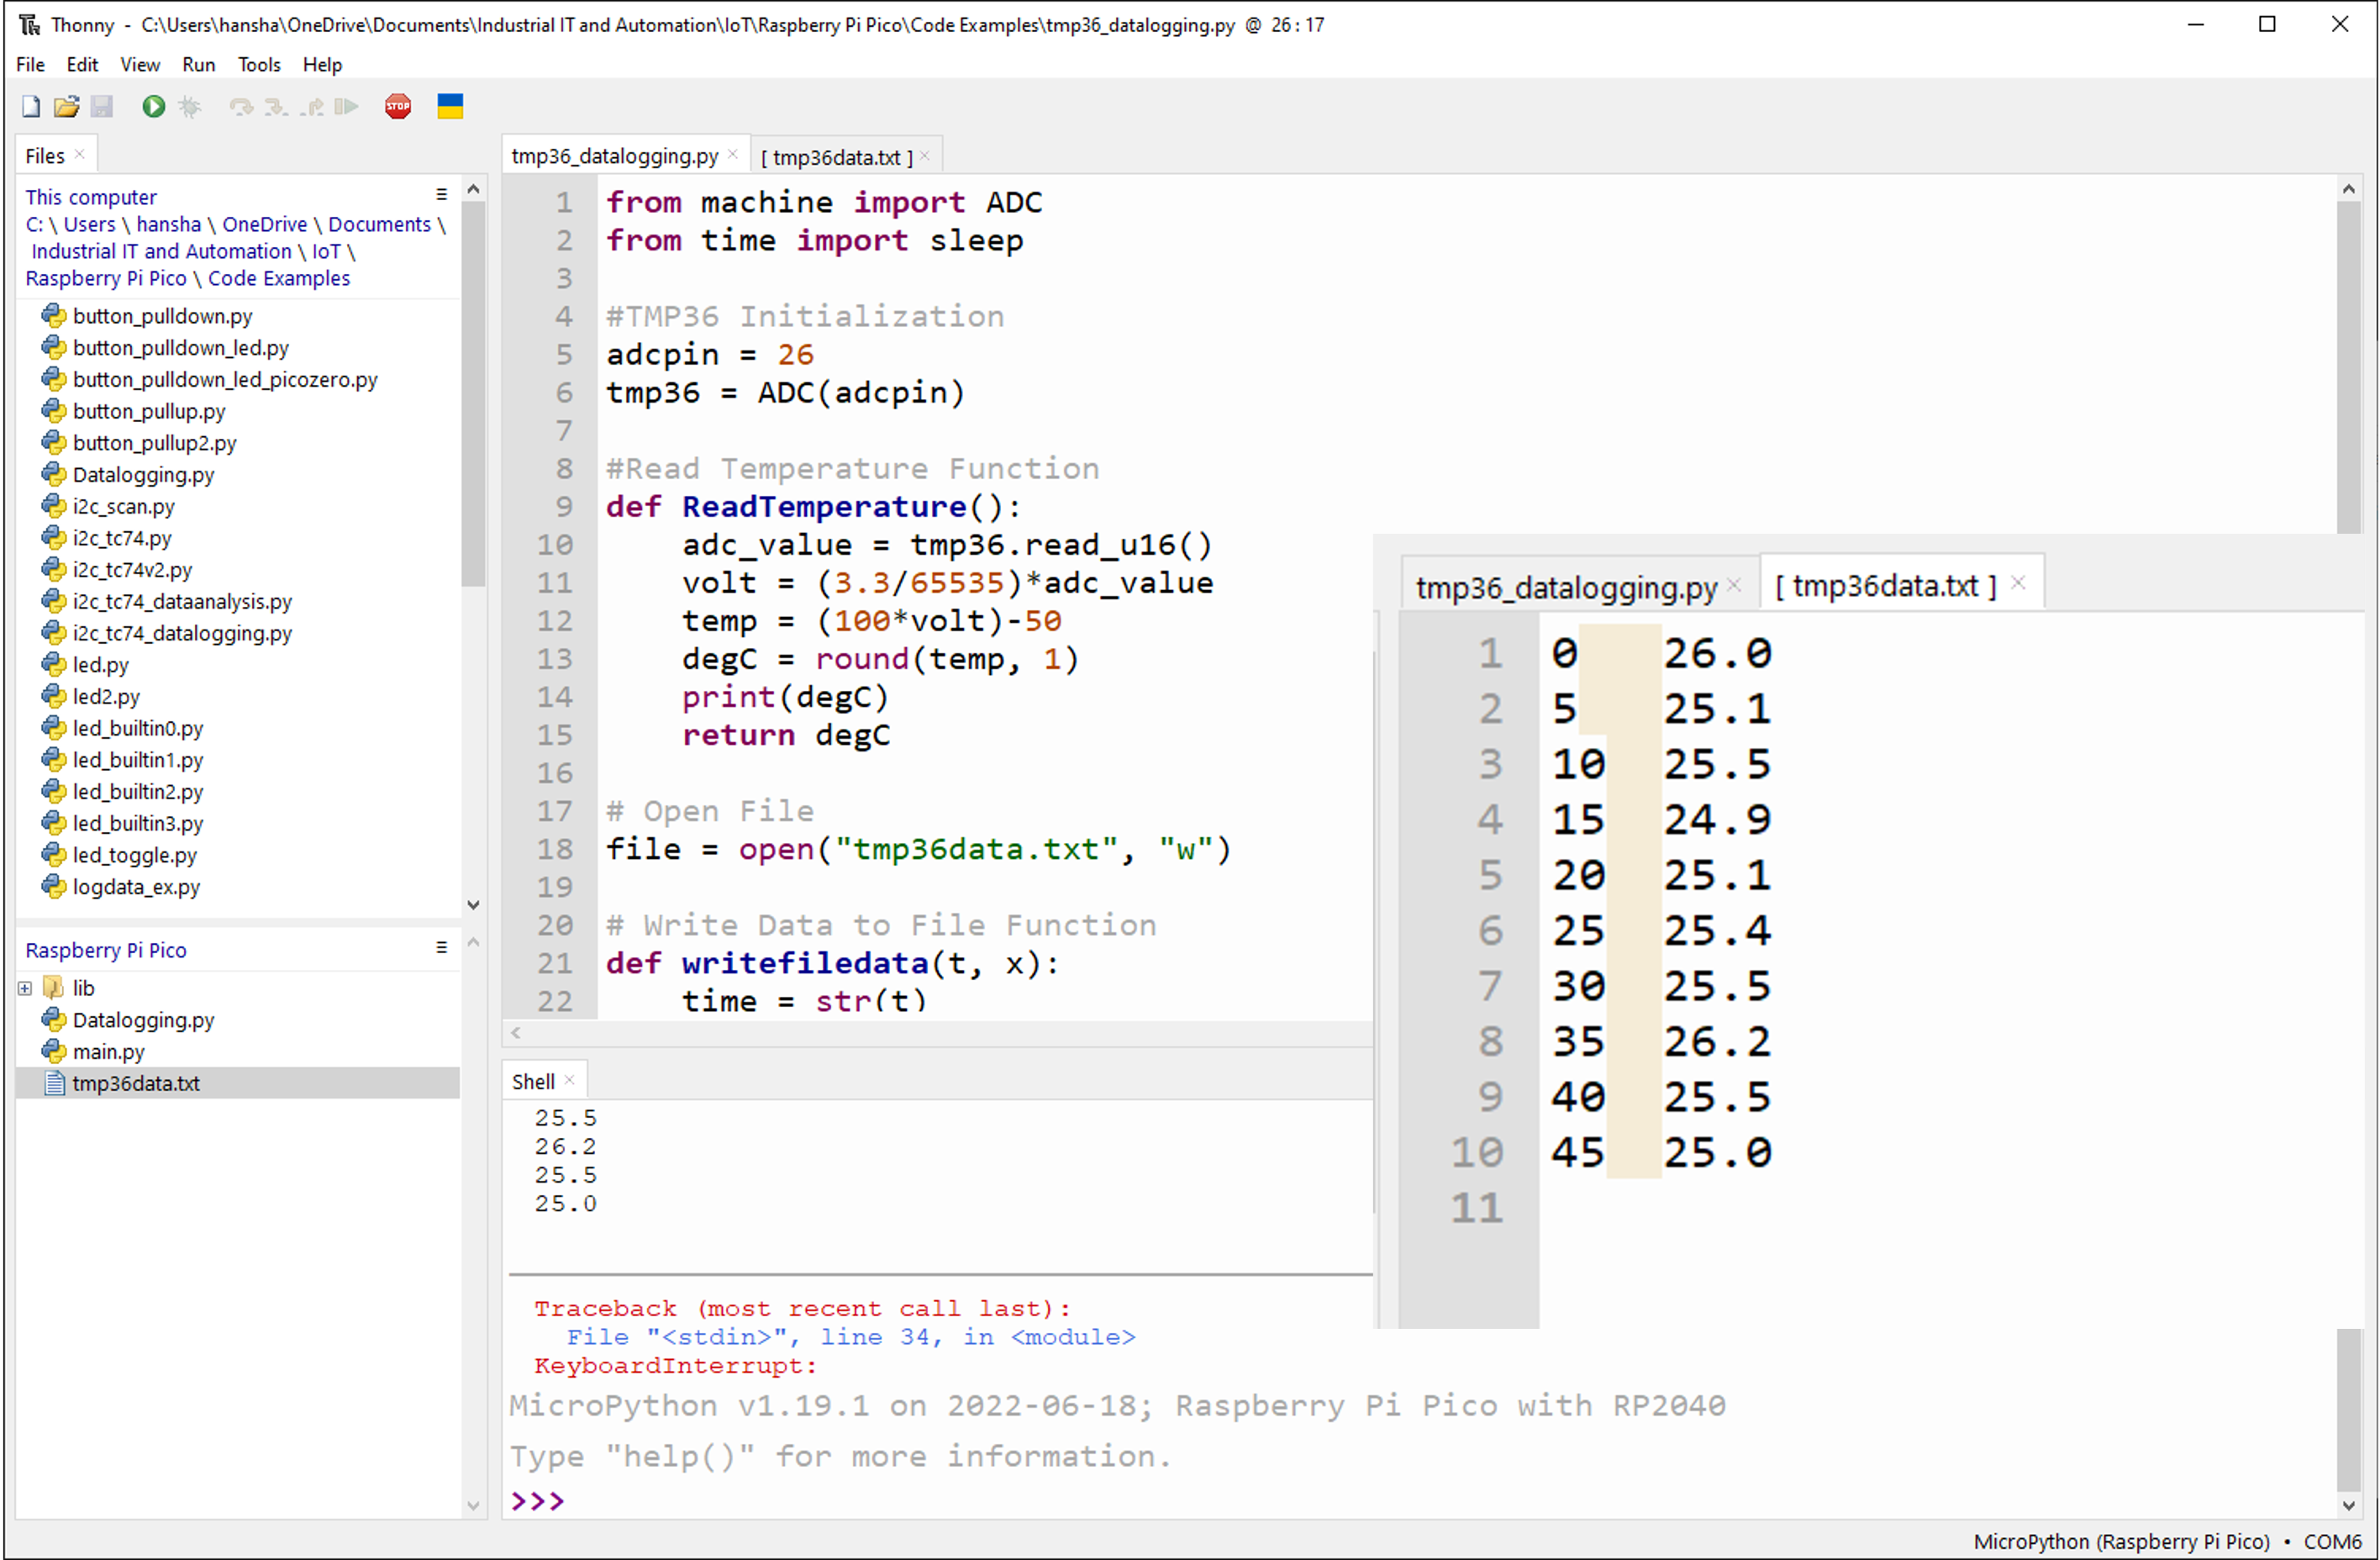
We see that the data has been stored in the file with 2 columns, the first column is the time in seconds, while the second column is the temperature value. The time value and the temperature value is seperated by a tab, so this is a socalled tabseparated file, which we can open in another Python application, in MS Excel, MATLAB, etc.
Updatet version:
You can also improve the code quality by putting the conversion part into a class and create a separate Python Module.
Python Module (Filename: Datalogging.py):
from machine import ADC

class Sensor:
    def __init__(self, pin):
        self.sensor = ADC(pin)

    def ReadTemperature(self):
        adc_value = self.sensor.read_u16()
        volt = (3.3/65535)*adc_value
        temp = (100*volt)-50
        degC = round(temp, 1)
        print(degC)
        return degC

class File:
    def __init__(self, filename):
        self.file = open(filename, "w")

    def WriteData(self, t, x):
        time = str(t)
        value = str(round(x, 2))
        self.file.write(time + "\t" + value)
        self.file.write("\n")
        self.file.flush()
More information/resources regarding Functions, Classes and Modules in Python:
Create Functions with Python (YouTube) + PowerPoint (PDF)
Create Classes in Python (YouTube) + PowerPoint (PDF)
Main Program (Filename: main.py):
We want to run the Datalogging without have a PC attached to the Pico. We need to save the code as "main.py", then this code will run when we plug the Pico to a Power Supply (PS). Finally, since we don’t see if the code is running or not on the Pico without having a PC attached to it, the code is updated making the built-in LED toggle (turns on/off) in each iteration inside the While loop as an indication that the loggin is running.
from Datalogging import Sensor, File
from time import sleep
from machine import Pin

pin = 25
led = Pin(pin, Pin.OUT)

adcpin = 26
tmp36 = Sensor(adcpin)

filename = "tmp36data.txt"
myfile = File(filename)

k = 0
Ts = 5

while True:
    degC = tmp36.ReadTemperature()
    led.toggle()
    myfile.WriteData(k*Ts, degC)
    k = k + 1
    sleep(Ts)
We see that the main program becomes neater/cleaner and we can more easily reuse code in other applications.
You can now unplug the Raspberry Pi Pico from your PC and use an external Power Supply to see if the program is working properly.
You can also click Ctrl + D in the Shell inside the Thonny Editor to force a soft reboot command. In both cases the "main.py" program should start to run automatically.
5 Data Analysis
We will copy the File to our PC and are then ready to do some Data Analysis. Finally, we will create a simple Python Script that opens the File and Plot the Data. Here we will use ordinary Python and the matplotlib.
Here you see a basic Data Analysis script that basically just opens the file with the data and plot it:
import matplotlib.pyplot as plt

# Open File
f = open("tmp36data.txt", "r")

# Transform File Data into x Array and y Array that can be used for plotting
x = []
y = []
k = 0
for record in f:
    record = record.replace("\n", "")
    record = record.split("\t")
    x.append(int(record[0]))
    y.append(float(record[1]))
    k = k + 1

f.close()

plt.plot(x,y, '-o')
plt.title('Temperature Data from TC74 Sensor')
plt.xlabel('Time[s]')
plt.ylabel('Temperature[°C]')
plt.grid()
plt.show()
More information/resources regarding Plotting and Mathematics in Python:
Plotting with Python (YouTube) + PowerPoint (PDF)
Mathematics in Python (YouTube) + PowerPoint (PDF)
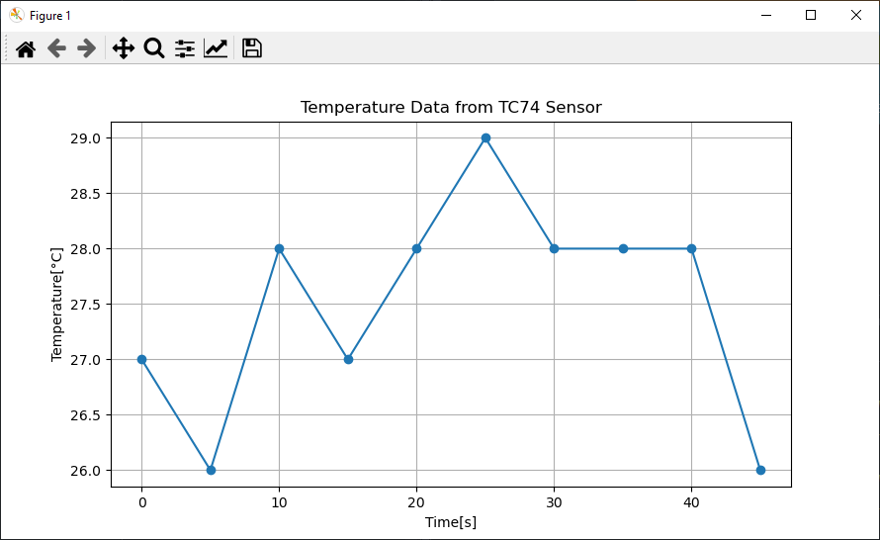
Here we see the plot that is generated by the Data Analysis script above:
We can improve the code by creating 2 Functions (GetFileData() and PlotData()):
import matplotlib.pyplot as plt

def GetFileData():
    # Open File
    f = open("tmp36data.txt", "r")

    # Transform File Data into x Array and y Array that can be used for plotting
    x = []
    y = []
    k = 0
    for record in f:
        record = record.replace("\n", "")
        record = record.split("\t")
        x.append(int(record[0]))
        y.append(float(record[1]))
        k=k+1

    f.close()
    return x, y

def PlotData(x, y):
    plt.plot(x,y, '-o')
    plt.title('Temperature Data from TC74 Sensor')
    plt.xlabel('Time[s]')
    plt.ylabel('Temperature[°C]')
    plt.grid()
    plt.show()

# Main Program
x, y = GetFileData()
PlotData(x,y)
6 Summary
So basically, in this tutorial we did the following:
- We read data from a Temperature Sensor using Raspberry Pi Pico and MicroPython
- Then we Log Temperature Data on a File on the Raspberry Pi Pico Device
- Then we will copy the File to our PC and are then ready to do some Data Analysis
- Finally, we will create a simple Python Script that opens the File and Plot the Data. Here we will use ordinary Python and the matplotlib library
Raspberry Pi Pico and Logging Sensor Dato (YouTube) + PowerPoint (PDF)
An alternative is to use Raspberry Pi Pico W which has builtin WiFi. Then we can consider logging the data directly a server or a cloud service.
Raspberry Pi Pico W and ThingSpeak Cloud Service

For more Raspberry Pi Pico Resources, Tutorials, Examples and Videos see the main Raspberry Pi Pico page.
Additional Resources
Below you will find more interesting and relevant resources
IoT
Internet of Things
Raspberry Pi
Raspberry Pi resouces