1 Introduction
Plotting Data in Windows Forms is something you often want to do. The built-in Chart Control for Windows Forms is no longer supported by Microsoft in the latest .NET versions. So, we need to find and use alternative solutions.
Many third-party Chart Tools exist. Most of these are commercial and costs money while others are free. This Tutorial will use ScottPlot, which is a free and open-source plotting library for .NET.
Plotting Data in Windows Forms using ScottPlot (YouTube) + PowerPoint (PDF)
Note! In the video above ScottPlot 4.x is used, while the PowerPoint above is updated with the newest ScottPlot 5 syntax.
The underlying architecture has been changed from ScottPlot 4 to ScottPlot 5, but the code is more or less identical. The main difference for the user is that you use AddScatter() in ScottPlot 4.x and you use Add.Scatter() in ScottPlot 5.x. The same for other plot types like Signal plot, e.g., AddSignal() in ScottPlot4 should be Add.Signal() in ScottPlot 5, etc.
Upgrading from ScottPlot 4.x to 5.x:
Do you already have an application made with ScotPlot 4.x? Follow thes esteps to upgrade:
- Upgrade to the newest NuGet package (version 5.x something)
- "ScottPlot.FormsPlot" is now "ScottPlot.WinForms.FormsPlot". You need to manually change this in the FormX.Designer.cs file(s).
- Change from
AddScatter()toAdd.Scatter()in your code. - Some other minor updates may also be nesessary depending on your code.
2 Getting Started with ScottPlot
In order to start using ScottPlot:
- Step 1: Install the ScottPlot.WinForms NuGet package
- Step 2: Drag a FormsPlot from the Toolbox onto your Form
- Step 3: Write the basic Code Example shown below
ScottPlot NuGet Package (use the newest ScottPlot 5.x):

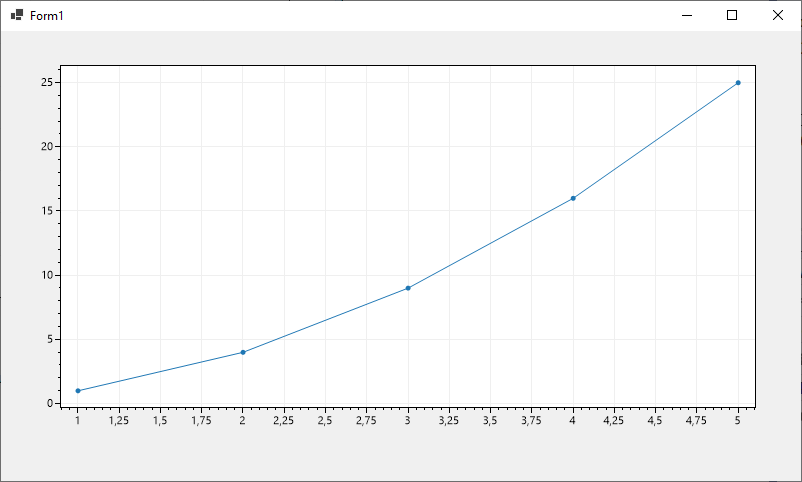
Basic Code Example:
double[] dataX = new double[] {1, 2, 3, 4, 5};
double[] dataY = new double[] {1, 4, 9, 16, 25};
formsPlot1.Plot.Add.Scatter(dataX, dataY);
formsPlot1.Refresh();
Note! For ScottPlot 4 you need to use formsPlot1.Plot.AddScatter(dataX, dataY);
For a start you can put the code inside "Form1_Load" Event Handler. "formsPlot1" is the default name, you can change the name in the Properties window in Visual Studio.
Next you can create a separate method like this:
using ScottPlot;
namespace WinFormsApp1
{
    public partial class Form1 : Form
    {
        public Form1()
        {
            InitializeComponent();
        }

        private void Form1_Load(object sender, EventArgs e)
        {
            CreateChart();
        }

        private void CreateChart()
        {
            double[] dataX = new double[] { 1, 2, 3, 4, 5 };
            double[] dataY = new double[] { 1, 4, 9, 16, 25 };
            formsPlot1.Plot.Add.Scatter(dataX, dataY);
            formsPlot1.Refresh();
        }
    }
}
Final Results:
You can also add Title, XLabel and YLabel like this:
formsPlot1.Plot.XLabel("Time[s]");
formsPlot1.Plot.YLabel("Temperature[°C]");
formsPlot1.Plot.Title("Temperature Sensor");
For details, see Getting Started with ScottPlot (YouTube). Note! In this video ScottPlot 4.x is used, while the code on this page is updated with the newest ScottPlot 5 syntax. The underlying architecture has been changed from ScottPlot 4 to ScottPlot 5, but the code is more or less identical. The main difference for the user is that you use AddScatter() in ScottPlot 4.x and you use Add.Scatter() in ScottPlot 5.x.
3 Real-Time Plotting
Typically we want to update the plot in Real-Time, e.g., we get data from a Sensor, e.g., a Temperature Sensor.
In the Example below a value from the builtin Random Generator in C# is used to update the Plot every second with a new value:
using ScottPlot;
using System.Windows.Forms;

namespace RealTimePlot
{
    public partial class Form1 : Form
    {
        double[] dataX = new double[0];
        double[] dataY = new double[0];
        int k = 0;

        public Form1()
        {
            InitializeComponent();
        }

        private void Form1_Load(object sender, EventArgs e)
        {
            InitializeChart();

            timer1.Interval = 1000;
            timer1.Start();

        }

        private void timer1_Tick(object sender, EventArgs e)
        {
            UpdateChart();
        }

        private void InitializeChart()
        {
            formsPlot1.Plot.XLabel("Time[s]");
            formsPlot1.Plot.YLabel("Temperature[°C]");
            formsPlot1.Plot.Title("TC-01 Temperature Sensor");
            formsPlot1.Refresh();
        }

        private double GetSensorData()
        {
            Random rand = new Random();
            double sensorValue = rand.NextDouble() * 10 + 20; //Random Value between 20 and 30
            return sensorValue;
        }

        private void UpdateChart()
        {
            k++;
            double newValue = GetSensorData();
            dataX = dataX.Append(k).ToArray();
            dataY = dataY.Append(newValue).ToArray();
            formsPlot1.Plot.Add.Scatter(dataX, dataY, color: Color.Orange);
            formsPlot1.Plot.Axes.AutoScale();
            formsPlot1.Refresh();
        }
    }
}
We have used a Timer to make sure the values are updated at a spesific interval. We have also added XLabel, YLabel and a Title.
Make sure to use, e.g., the AutoScale() and Refresh() methods at the end to make sure the plot is updated successfully.
For details, see Getting Started with ScottPlot (YouTube)
Note! In the video above ScottPlot 4.x is used, while the code above is updated with the newest ScottPlot 5 syntax. The underlying architecture has been changed from ScottPlot 4 to ScottPlot 5, but the code is more or less identical. In ScottPlot 4 you need to use AxisAuto() and Render() methods instead (which is shown in the video).
4 Plotting Data from SQL Server Database
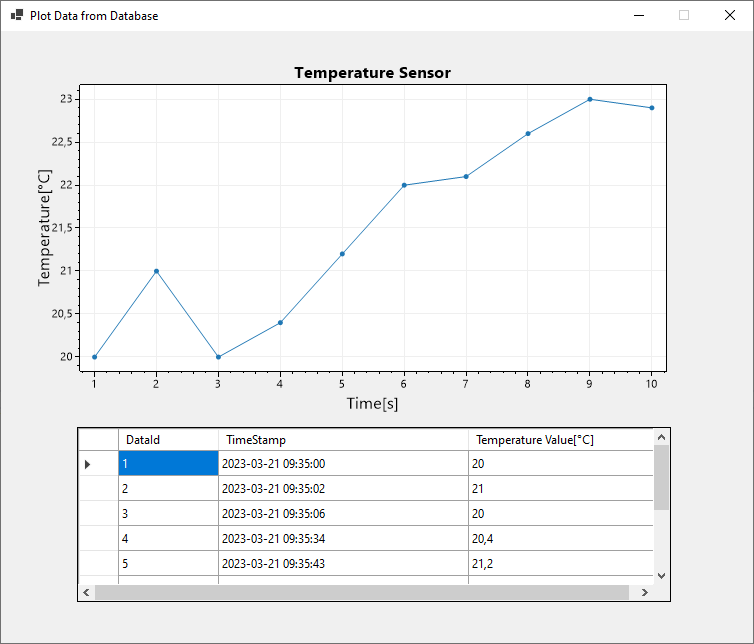
Here we will demonstrate how to retrieve data from a Database. We will use SQL Server. We will put the Data into a GridView and we will plot the Data using ScottPlot.
The Database Plotting Application looks like this:
We start by creating a SQL Server Database (e.g., "SENSORSYSTEM) in SQL Server Management Studio.
We create a basic Database Table with use of SQL Server Management Studio:
CREATE TABLE [DATA]
(
    [DataId]  int  NOT NULL  IDENTITY ( 1,1 ) Primary Key,
    [DataTimeStamp] datetime  NOT NULL DEFAULT GETDATE(),
    [DataValue]   float  NOT NULL
)
go
Then make sure to insert some test data into that "DATA" Table:

Then we create a separate Class (e.g., "SensorData.cs") for the code that retriving data from the database:
using Microsoft.Data.SqlClient;

namespace DatabaseChart.Classes
{
    internal class SensorData
    {
        public int DataId { get; set; }
        public string? DataTimeStamp { get; set; }
        public double DataValue { get; set; }

        public List GetSensorData()
        {
            string connectionString = "Data Source=COMPUTERNAME\\SQLEXPRESS;Initial Catalog=SENSORSYSTEM;Integrated Security=True; TrustServerCertificate=True";

            List sensorDataList = new List();
            SqlConnection con = new SqlConnection(connectionString);

            string selectSQL = "SELECT DataId, DataTimeStamp, DataValue FROM DATA";
            con.Open();
            SqlCommand cmd = new SqlCommand(selectSQL, con);
            SqlDataReader dr = cmd.ExecuteReader();
            if (dr != null)
            {
                while (dr.Read())
                {
                    SensorData sensorData = new SensorData();

                    sensorData.DataId = Convert.ToInt32(dr["DataId"]);
                    sensorData.DataTimeStamp = dr["DataTimeStamp"].ToString();
                    sensorData.DataValue = Convert.ToDouble(dr["DataValue"]);
                    sensorDataList.Add(sensorData);
                }
            }
            return sensorDataList;
        }
    }
}
Make sure to install the NuGet package Microsoft.Data.SqlClient. The Class has been put into a separate Folder called "Classes". This is not necessary but if you want to make more Classes later then you wil have all your Classes in the same folder.
Main Application Code:
using DatabaseChart.Classes;

namespace DatabaseChart
{
    public partial class Form1 : Form
    {
        public Form1()
        {
            InitializeComponent();
        }

        private void Form1_Load(object sender, EventArgs e)
        {
            GetData();
        }

        void GetData()
        {
            List sensorDataList = new List();
            SensorData sensorData = new SensorData();
            sensorDataList = sensorData.GetSensorData();

            //Convert Data from Database to Arrays used by ScottPlot
            double[] dataX = new double[sensorDataList.Count];
            double[] dataY = new double[sensorDataList.Count];

            int i = 0;
            foreach (SensorData data in sensorDataList)
            {
                dataX[i] = data.DataId;
                dataY[i] = data.DataValue;
                i++;
            }

            CreateChart(dataX, dataY);
            CreateGridView(sensorDataList);
        }

        void CreateChart(double[] dataX, double[] dataY)
        {
            formsPlot1.Plot.XLabel("Time[s]");
            formsPlot1.Plot.YLabel("Temperature[°C]");
            formsPlot1.Plot.Title("Temperature Sensor");

            formsPlot1.Plot.Add.Scatter(dataX, dataY);
            formsPlot1.Refresh();
        }

        void CreateGridView(List sensorDataList)
        {
            dataGridView1.DataSource = sensorDataList;

            dataGridView1.Columns[0].HeaderText = "DataId";
            dataGridView1.Columns[1].HeaderText = "TimeStamp";
            dataGridView1.Columns[2].HeaderText = "Temperature Value[°C]";

            dataGridView1.Columns[0].Width = 100;
            dataGridView1.Columns[1].Width = 250;
            dataGridView1.Columns[2].Width = 190;
        }
    }
}
For details, see Plotting Data from SQL Server Database using ScottPlot (YouTube). Note! In the video above ScottPlot 4.x is used, while the code above is updated with the newest ScottPlot 5 syntax. The underlying architecture has been changed from ScottPlot 4 to ScottPlot 5, but the code is more or less identical. The main difference for the user is that you use AddScatter() in ScottPlot 4.x and you use Add.Scatter() in ScottPlot 5.x.
Additional Resources
Below you will find more interesting and relevant resources
Visual Studio/C#
Visual Studio/C# Resouces
Python
Python Programming Resources.